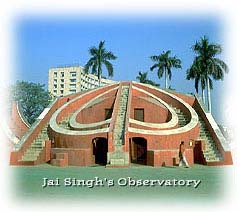
Before the great Indian maps
of the 18th century were drafted, the Maharaja Sawai
Jai Singh II built his observatory at Jaipur.
More »
Photo by Deb K. Roy
|
|
|
|
A Shared Reality
“Inherited from the past were the fables and legends of Greece and Rome, along with tales from Celtic and Norse mythology. These were blended with information brought back by occasional mariners, who, in expanding their trade routes, ventured a bit farther than any before them, or by chance came upon an unknown island when tempestuous weather blew their vessel off course. Gradually, this mixture of legend, speculation, and travelers' tales began to be replaced by a new kind of geographic knowledge, one that was the result of direct observation.”
Donald S. Johnson
Phantom Islands of the Atlantic
Maps as Metaphor
In the beginning, maps were fiction. We perceived our world as myths defined by belief not geography. Maps of these imagined worlds came in many shapes and sizes, but they all mixed the unreal with snippets of the real world. The process of mapping the real world was one of going from geographies of ideas to maps of real geography. On the Internet, we will pursue a reverse path: maps of the Internet will progress from our current maps of network topologies to maps of virtual worlds that we build, maps of ideas and thoughts.
Maps have always been consensual hallucinations filled with imaginary borders, islands, and oceans,
not objective truth. The Greeks pioneered the field of theoretical geography, maps of the world as it ought to be. (A good example of theoretical geography can be found in Aristotle's classic work
Meteorologica, Aristotle VII, Loeb Classical Library : No. 397.) The process of making the maps that we know today took 2,000 years.
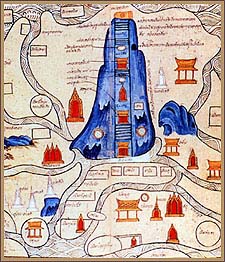
By the Middle Ages, theoretical maps became highly stylized as mappa mundi, the classic “T-O”
maps (see below). Theoretical geographers saw the ocean as one large body surrounding the “O.” The O was crossed with a T: the top of the letter symbolizing the Nile, the leg of the letter the Mediterranean. The land 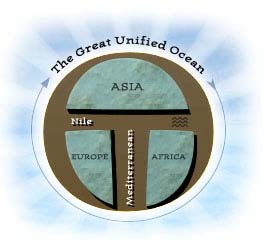 on the top was Asia; on the bottom left, Europe; on the bottom right, Africa. on the top was Asia; on the bottom left, Europe; on the bottom right, Africa.
Stylized maps were the rule, not the exception. In Asia, maps mixed stories of cosmology with travel times between villages. In Australia, Aboriginal Songlines were primarily guides to ancient history and culture rather than walking directions between landmarks, though they certainly served both purposes.
(See David Turnbull's
Maps Are Territories: Science is an Atlas for an excellent description of these maps.)
All maps provide one thing: an abstraction of the world from one point of view. Maps help us find things. But maps did not spring into being. First, there was a long, long process of surveying the world, building tools, and experimenting. As our knowledge of the real world increased, and as our tools
to measure altitude, longitude, and latitude came into being, maps became more “objective.” Maps became tools for navigation, guides to travel on country roads and the location of inns, eventually becoming the modern documents that describe everything from subway systems to the human genome to the solar system. Maps are the end result of building infrastructure to help us discover and navigate our world.
Net Maps
In the real world, mapping went from imagination to reality. On the net, we are taking the opposite path. Mapping the topology of a local area network is almost trivial. Mapping the large-scale routing topology of the net is far from trivial, but researchers at CAIDA are making real progress in building such topology-based maps of the Internet infrastructure.
Maps help us navigate. On the Internet, finding things has become the big challenge. Death by a thousand clicks is the bane of any net user. The reason? We are attempting to shoe-horn the metaphor of maps–tools for navigating complex spaces–into existing metaphors, such as the infinite book that is the World Wide Web.
The Internet is a network of many metaphors. The core infrastructure supports many protocols, and each protocol adopts a metaphor. Electronic mail uses analogies taken from a postal service. Streaming media
started with a radio metaphor before evolving into a unique medium. The World Wide Web is also a metaphor–pages in an infinite book.
What is missing today is a metaphor that helps us tackle the problem of meta-information: information about information. As we look at a page on the Web, the logical next step is to find other pages that are conceptually near. Near, of course, varies on your point of view. Meta-information is what helps the Internet become smarter about organizing itself. As we develop the tools to describe Internet resources, to manage meta-information, maps will happen. Until then, we are stuck in a world of many facts: all content, no context.
Metaphors all have limits, and it is important to understand that maps of the Internet, and of virtual worlds built on the Internet, will look and act very different from from the folded static bitmaps we use to navigate the real world:
- Objects on Internet maps will be active. Clicking on a map object will trigger an action. Perhaps a Web browser springs up, perhaps another map is brought in, perhaps you will zoom to another context. These actions associated with map objects will vary depending on the user's perspective and the context of the object on a map.
- The visual representation will be secondary. Maps will morph into many displays. The critical element is the description of meta-information.
Good network maps will be visualized many different ways.
- Maps will be rearrangeable. If you are looking at a map, you should be able to cut and paste objects from one map to another. You should be able to customize a map by overriding the existing properties: change the locations of objects, their visual representation, or the actions associated with them.
- Maps will be distributed. One map, a representation of many objects and the relationship of those objects to each other, can be created and maintained by many people and bring in objects from many locations.
- Maps will be dynamic and static. A map is a representation of underlying objects. If new objects come into being (e.g., new web sites spring into being that are relevant to your interests), they should show up on your map. But, these new objects
should appear in the proper place on the map. This balance between dynamic data and the semi-static demands of the digital cartographers is one of the key challenges facing Internet mapmakers.
An Algorithm is Not a Map
If everything is the same, there is nothing to map. We need to lay the groundwork first. The key to this
is the emerging field of Internet meta-information.
Over the last two years, a series of new companies have begun to address pieces of the meta-information problem. Google is an excellent example of a company that does a good job of searching, weighting the relative importance of web sites using a technique known as eigenvector analysis. (For more information, see the Stanford
Google Project and the somewhat related IBM Clever Project.)
Google is an example of resource discovery: finding information about information (in this case, the importance of a web site). Now, let's look at the other side of the coin: how that information is displayed. On the Google web site, your results always come back the way Google decided to present them, as a web page with a list of hits.
The hyperbolic tree is an algorithm for visualizing data. One of the best examples of the hyperbolic tree came out of Xerox PARC and is now commercialized by a Xerox spin-off, Inxight. Hyperbolic trees are a way of visualizing large, complex datasets. But, you can't visualize your Google results with a hyperbolic tree. You have to take your Google the way they serve it. No special orders. (Inxight Software, Inc., founded in 1996, recently changed the name of the product from The Hyperbolic Tree™ to the zingier Site Lens™)
Hyperbolic trees are a perfect example of why we need flexibility in visualizing data. The hyperbolic tree algorithm is great for certain kinds of data, but any one way of seeing gets old quickly, particularly if the paradigm is not appropriate to the data. When there's a lot of data involved,
so many points are visible, all rotatable on any axis, that I lose perspective and after a while I can't see the forest for the hyperbolic trees.
In looking at a space such as the one that Google builds for navigating the Web, I would like to be able to switch from a hyperbolic tree to another way of visualizing the same space, say the Brain, a much more intuitive way to look at interlinked structures, such as web sites.
“Late binding” of different visualization tools to organized meta-information is a fundamental requirement for effective Internet maps. Late binding means that the visual interface is applied to the data as late as possible in the process: the data are not specifically organized for a particular interface such as the hyperbolic tree. Instead the data are tagged with semantic meaning using XML as a foundation.
XML is an important building block, a necessary but not sufficient condition. The tagging
of information, particularly deep wells of structured data, is definitely the challenge for which XML provides a tool. But, just as the Web is much more than HTML, XML provides only a partial foundation for Internet maps. The meta-information are the features that make up the geography of an Internet map, the rivers and mountains that distinguish one area from another. Only when this raw material has been categorized will visually rich, dense, and perhaps even useful maps come into widespread use. Just as the Web required a suite of tools–HTTP, plug-ins, MIME types, style sheets, and scripting languages–mapping the Internet will require more than XML. Indeed, just as the Web succeeded because people actually used it, one of the keys to meta-information will be getting large amounts of real content tagged and organized.
Consensual hallucinations require considerable preparation. Maps are a shared version of reality. Once the infrastructure to share reality is in place, maps will flourish. Until then, maps of the Internet will be cartographic fiction, the creative musings of poets rather than shared constructions of reality.
Copyright © 1999, 2000 media.org.
|