 |
 |
Martin Dodge is a
Researcher in the Centre for Advanced Spatial Analysis (CASA), University College London and is the creator of the Atlas of Cyberspaces.
» Previous Issues
|
|
|
Further Reading:
»For more information about this subject, the following resources are recommended.
Related Article Topics:
» (1) Web site mapping functions are part of major html authoring packages like Microsoft Frontpage or Adobe PageMill. There are also more specialised packages such as Astra SiteManager and CLEARweb.
» (2) Borges on Cartography:
"In that Empire, the craft of Cartography attained such Perfection that the map of a Single Province covered the space of an entire City, and the Map of the Empire itself an entire Province. In the course of Time, these Extensive maps were found somehow wanting, and so the College of Cartographers evolved a Map of the Empire that was of the same Scale as the Empire and that coincided with it point for point. Less attentive to the Study of Cartography, succeeding Generations came to judge a map of such Magnitude cumbersome, and, not without Irreverence, they abandoned it to the Rigours of sun and Rain. In the western Deserts, tattered Fragments of the Map are still to be found, Sheltering an occasional Beast or beggar; in the whole Nation, no other relic is left of the Discipline of Geography."
Jorge Luis Borges, From "Of exactitude in science" in A Universal History of Infamy.
» (3) See Tim Bray's paper, "Measuring the Web", presented at the Fifth International Conference on the World Wide Web, May 1996, Paris.
» (4) The leading research groups analysing the structure of the Web are:
In addition, there are also a number of commercial "audience rating" style measurement of the most popular web sites:
» (5) The home page of Eugene Garfield with the Science Citation Index.
» (6) The University of Illinois, Urbana-Champaign (UIUC) home of the Mosaic browser.
» (7) For more information on fascinating history and meaning of totem poles, see "Totem poles: an exploration".
|
|
|
|
|
Buy the Book Today!
|
|
|
|
|
|
|
|
Tim Bray's Hyperlink Totems (1995)
How do you map the Web? An obvious approach is to map the hyperlink structures as some kind of graph, either in two or three dimensions. This is quite easy for individual sites, and tools exist for web masters and designers to do this [1], but to map the many millions of web pages and their interweaving hyperlinks is an altogether more challenging task. One could argue that it is also a foolish task as the Web is in fact its own map, and it is impossible to produce a better one. This idea harks back to Jorge Luis Borges' famous Cartography fable, with the Web being both the territory and the map [2]; by mapping it in detail one simply ends up creating it anew.
While the Web as map and territory is conceptually true, there is still a need for maps of it that simplify and generalise, highlighting the interesting and hiding the superfluous detail. What people want is the map of the Web from a distance, floating above it somehow, so they can get a sense of the broad view of the information landscape; not the highly detailed graph-like mesh of every single page and link.
A few years ago Tim Bray took the challenge and produced some fascinating, and very unconventional, maps of the Web landscape [3]. Bray is a programmer and all-around general hacker of text, hypertext and XML, based in Vancouver. Before he could map the Web, he needed to take some measurement of it using a large search engine index as the easiest source. He calculated key metrics on structure of the known Web in 1995, comprising a mere eleven million pages from about 90,000 sites, to answer the fundamental questions - how big it is? how wide is it? where is the centre? how interconnected is it? These questions are still very relevant to academic researchers and commercial pundits today [4]. Much of the research into understanding Web morphology focuses on the analysis of the human-built hyperlink structures, the aim being to improve current Web searching tools and develop new searching algorithms to find the elusive nuggets of gold that lie hidden in the ever growing expanse of the Web. The importance of hyperlinks rests on the fundamental assumption that they are conscious recommendations people make to Web sites or pages that they think are useful or of interest. In this manner hyperlinks play the same role as citations in scientific literature. There are decades of research into citation analysis, pioneered by Eugene Garfield [5] and the Science Citation Index, trying to understand and map out the intellectual structures of scientific ideas and disciplines.
Bray spent time analysing the hyperlink structures of the Web and found interlinking between sites was surprisingly sparse. Most links were local, within a site and only a few key sites acted as super-connectors tying sites together - Yahoo! being the epitome of this, the master weaver of the Web. He derived two intuitive measures of Web site character based on hyperlinks - visibility and luminosity. Visibility is a measure of incoming hyperlinks, the number of external Web sites that have a link to them. He found a select few highly visible sites with many thousands of incoming links, they are the bright stars of the Web. In 1995, the most visible Web site was that of the University of Illinois, Urbana-Champaign (UIUC), the home of the Mosaic browser [6]. The vast majority of sites had only a few links to them and nearly five percent had no incoming links at all. Measuring the reverse, the outgoing links, determines a site's luminosity. The top few percent of most luminous sites obviously carry a disproportional amount of navigational workload. Yahoo! was the most luminous site in 1995 and probably still is today.
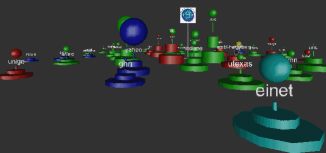
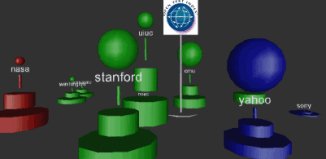
Bray used statistical characteristics to map the key landmarks of the Web in 1995, highlighting the largest, most visible and connected Web sites. The visual metaphor employed to represent Web sites was radically different from conventional maps, having more in common with architectural models than planar cartography. He used abstract, 3d models which I think look like a cross between the pieces on a chess board and totem poles. (He termed his model ziggurats, the ancient stepped pyramidal temples.) I think the analogy with totem poles, created by native American peoples of Pacific Northwest [7], is particularly apt because they were powerful emblems of a family or clan. Bray's models were totems of Web sites in 1995.
The web site totems visualise the degree of luminosity and visibility of a site, along with the size of the site and the broad category it was in (government, education, commercial, etc.). The basic graphic properties of the totem, size, shape and colour, were used to encode these four dimensions of a web site. The overall height of the pole represented visibility, the width of the pole is size of the site, in number of pages. The size of the globe atop the pole maps the site's luminosity and finally colour coding was employed for different categories (green for university, blue for commercial, red for government agencies). The totems were also labeled with the domain name of the site for identification. The spatial layout of the totems on the ground plane was based on the strength of the hyperlink ties between them.
The two images show a field of totem poles mapping the Web sites at the very core of the Web in 1995. Further from this core region there would be many thousands other, but most would be minuscule in relation to the mighty totems at the heart. The totemic models were constructed automatically from site statistics using VRML. These examples are simply static screen-grabs of the 3d models.
Today, Bray's web site totem poles stand as historic monuments to the early days of the Web. They have yet to be repeated, but in a recent email, he reported that he is back in the Web mapping business, spending eighty hour weeks working on what to map and appropriate visual metaphors to represent it. I asked him what his 'ultimate' map of the Web would be like, his answer was for a characteristically unconventional visualisation,
"I don't see it like the visions of Gibson and Stephenson - glowing abstract colour-on-black geometries. My vision is more like a bazaar in Damascus or a mall in Kowloon - a lot of disorderliness, organic rather than planned growth, some parts smell bad, full of surprises."
We should keep an eye on his home page (http://www.textuality.com/) and wait for the sounds and smells of a new disorderly Web map to emerge.
Copyright © 1999, 2000 media.org.
ISSN: 1530-3314
|
|