|
|
Internet Arcs Around The Globe (1996)
The globe is one of the most powerful visual metaphors to map the geographical dimensions of large networks like shipping lines, trade flows, airline routes and communications such as the Internet. A team of researchers, Tamara Munzner, K. Claffy, Eric Hoffman and Bill Fenner produced visually striking, interactive maps of part of the Internet using arcs encircling an Earth globe [1]. They were mapping the global topology of a particular subset of the Internet known as the MBone (see sidebar) from the mid 1990s using essentially the same style of arc-node representation used to map the ARPANET, except projected into three-dimensional space around a globe.
Other scientists have also done significant research into interactive mapping of communications networks using three-dimensional global models, most notably Stephen G. Eick and colleagues at Bell Labs [2]. While the MBone has also been mapped by others, for example Elan Amir's abstract graph of the MBone [3] from the August 1996 and the CAIDA research group developed an interactive MBone mapping tool called Manta Ray, but it uses flat, two-dimensional representations [4].
The infrastructure of the MBone has grown into a very complex and inefficient topological structure, with many duplicate, redundant tunnels. The inefficient structure is a problem because it causes unnecessary waste of scarce Internet capacity and undermines the very principle of multicasting. What was needed to make sense of the global MBone topology was some form of map.
Munzner and her colleagues grasped the challenge of mapping the MBone, using curving arcs between node routers geographically positioned on a three-dimensional globe. They comment that, "one strong advantage to our current 'arcs on globe' geographical layout is that viewers understand it immediately with little explanation". The graphical framework for their visualisations was provided by a 3d globe, with country boundaries, along with US state and Canadian provincial borders, to provide suitable geographical context. Curving lines between router locations were employed to represent the actual MBone tunnels, with colour and thickness used to show characteristics of the tunnels, while the height of the arcs above the surface of the globe was simply a function of distance. The longest tunnels were drawn as the highest arcs, as can be seen in the figures below. This makes sense in the context of understanding the MBone topology because long links that span large parts of the Internet are most important and are highlighted on the visualisations by the facts that high arcs are afforded greater visual prominence. It should be noted that these MBone visualisations only show the structure of this network and not any data on traffic actually flowing over the links.
A significant problem they faced was determining the geographic location of the MBone routers. This proved to be a time-consuming process, involving considerable amounts of manual effort. This is symptomatic of a wider problem of the lack of a reliable, automatic means of geographically locating Internet infrastructure which is the key impediment to mapping the Internet.
One of the aims in their MBone mapping endeavours was to make the results as widely available as possible and, also, make the maps as interactive as possible, so people could really explore the topology for themselves rather than being presented with predetermined, static images. To achieve these aims Munzner et al produced their 3d "arcs on the globe" maps in VRML. So rather than just producing static maps, they made 3d models that can be downloaded from the Web and viewed interactively, using an appropriately configured browser, on the end-users computer. It is possible to download and explore their maps for yourself from the “Planet Multicast” Web site.
 fig. 1
 |
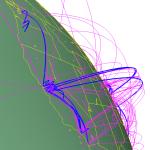 fig. 2
 |
|
© 1996 Tamara Munzner (Stanford University), Eric Hoffman (Ipsilon Networks), K. Claffy(NLANR), and Bill Fenner (Xerox PARC) |
|
The figures give two screen-shots of the 3d global maps. The first is a view of the whole globe, from several hundred miles out in space, with a dense mesh of arcs criss-crossing the USA from coast to coast, along with higher, longer transcontinental tunnels curving around the globe. This shows many hundreds of different tunnels, from the MBone topology for early 1996.
The second figure is a view taken from a low angle, close to the surface of the globe off the coast of California. Looking across the continental US from this angle the density of looping arcs of varying heights is apparent. Lateral links along the West coast, as well longer tunnels from the East coast, can be discerned. Certain tunnels are highlighted using different colour and thickness of lines indicating that they are of a different specification.
Two of the principle "cartographers" - Tamara Munzner and K. Claffy - who created the 3d MBone maps, are pioneers in mapping the Internet. Munzner is a graduate student in the computer graphics laboratory at Stanford University and her principle research has been in visualising information. K. Claffy is a leading researcher in Internet data analysis and visualisation and she directs CAIDA. Since their Mbone mapping work in 1996, both have been active in visualising different aspects of the Internet and I shall be looking at more of their work in future columns. But for now, we can enjoy their global maps of the Internet MBone, which provide a visual image of the net that match many peoples imagination of what it should look like, a complex mesh of arcs around the globe.
Copyright © 1999, 2000 media.org.
ISSN: 1530-3314
|
|