 |
|
|
||||||||||||||||||||||||||||||||||||||||
|
The Netscan Project
Despite all the froth and hype of the “dotcom economy,” the real transformative power of the Internet comes not from ecommerce but from the new and varied forms of communication that it enables between people. Email, chat, instant messaging, mailing lists and the like are providing channels and forums for a huge diversity of social interactions [1], giving rise to new ways of organizing and living. How many of us have come to rely on email for communications could you imagine living without it? One of the largest, most diverse and long running social spaces on the Internet is Usenet news. If you are unfamiliar with it, Usenet is a vast collection of discussion spaces known as newsgroups. These are based on particular topics, such as discussion of a TV show or technical questions about graphics cards and are arranged in hierarchies. These newsgroup hierarchies have grown into a large decentralized, anarchistic global social network. Each newsgroup has its own particular conversational style and social ambience, and together they comprise perhaps the most diverse portion of social cyberspace, in which hundreds of thousands of people carry on discussions, share technical tips, provide support, and hold heated arguments and debates and vicious flame-wars. Many more people silently read these daily interactions without actively contributing. The Net commentator Howard Rheingold provided a vivid description of the multi-faceted social form of Usenet in his 1993 book Virtual Community [2]: “a place for conversation or publication, like a giant coffeehouse with a thousand rooms; it is also a worldwide digital version of the Speakers Corner in London's Hyde Park, an unedited collection of letters to the editor, a floating flea market, a huge vanity publisher, and a collection of every odd special-interest group in the world.” (page 130). Usenet started as hack by grad students in 1979 and today has about 27,000 active newsgroups, which have around 675,000 daily messages posted in them. (There are no exact numbers because of its inherently decentralized structure.) Beginning to untangle and map out the complex social structures of Usenet is a great challenge. One which sociologist Marc A. Smith has grappled with over the past 6 years or so through his Netscan project [3]. This ambitious initiative began as a graduate project at the University of California Los Angeles in 1994 and continues to develop under the aegis of Microsoft Research. Map of the Month discussed its aims with Smith in a recent email interview. Usenet provides a fascinating sociological case study of online interaction for Marc Smith, being the most interesting of the social cyberspaces that have emerged through the Internet. Even though Usenet lacks a single, central authority, its user communities have developed sophisticated social structures and mechanisms and Smith notes, Usenet is a place where cooperation should be hard, but cooperation happens there anyway and with an abundance and profusion that is remarkable. Usenet does have its problems and its imminent demise has been long predicted, with many newsgroups plagued by mass spam posting. It has also suffered a perennial image problem being forever associated in the popular media with the worse Net excesses of porn, racism, and extreme views.
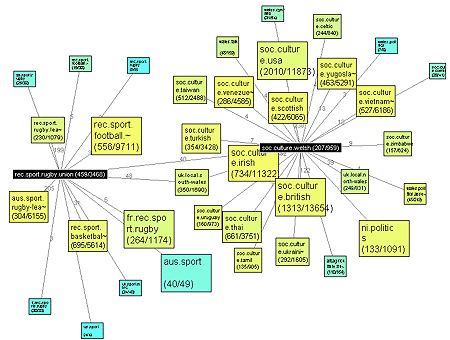
Netscan provides a growing range of tools and visual interfaces to explore Usenet. Smith aims to provide interactive maps of Usenet to reveal just how successfully these [news]groups really are, to see a kind of satellite photo of a large swath of a social cyberspace. Currently, Netscan provides three distinct visual interfaces, the Score Card, Cross Post and Dashboard visualizations, which are fully interactive and accessible through the Web. Behind these “maps” is a significant data-crunching infrastructure with over a terabyte of disk storage to cope with the daily deluge of postings. The cross post visualization is perhaps the most interesting current element of Netscan [4]. It enables you see and explore the social relationships linking newsgroups. These relationships are human-created and dynamic, resulting from individual decisions to post a message to several newsgroups at once. This is known as cross-posting and can be useful for sharing relevant information amongst a wider group of interested people. (It is also, unfortunately, commonly used by spammers to hit large numbers of newsgroups simultaneously.) So the cross post visualization tries to map out the social bonds that are forging online communities. The cross-posting structure in represented by an interactive graph display.
In this example, the map reveals the social network of interlinked groups that surround two newsgroups - soc.culture.welsh and rec.sport.rugby.union. The black boxes show these selected newsgroups and the colored ones are the linked groups. The gray lines show the links, with labels showing the number of cross posted articles. These two newsgroups are surrounded by a cluster of linked groups, and interestingly they are also interconnected directly (by some 40 cross posted articles) as well as mutually linked through the group uk.local.south-wales. The system provides a user with number of parameters that can be modified to refine the display. The best way to appreciate the potential of the Netscan system is to try it out for yourself.
The Netscan project is ongoing, but some of its key findings thus far are that Usenet “...continues to grow rapidly, that it is a remarkably international system, that it is not all pornography” says Smith. Netscan clearly shows Usenet also hosts a diverse range of different communities with distinctive styles of social interaction from long running discussions to heated political arguments, to simple job listings, file sharing, and Q&A technical support groups. What the Netscan team are learning about processing, analyzing and visualizing the Usenet can hopefully be generalized and applied to other online social spaces. We will certainly be needing better tools and interfaces to manage online social interaction, which is becoming an increasingly significant component of people's lives. Copyright © 1999-2001 media.org. ISSN: 1530-3314 |
|||||||||||||||||||||||||||||||||||||||||
|


